Individual Sector Visualization
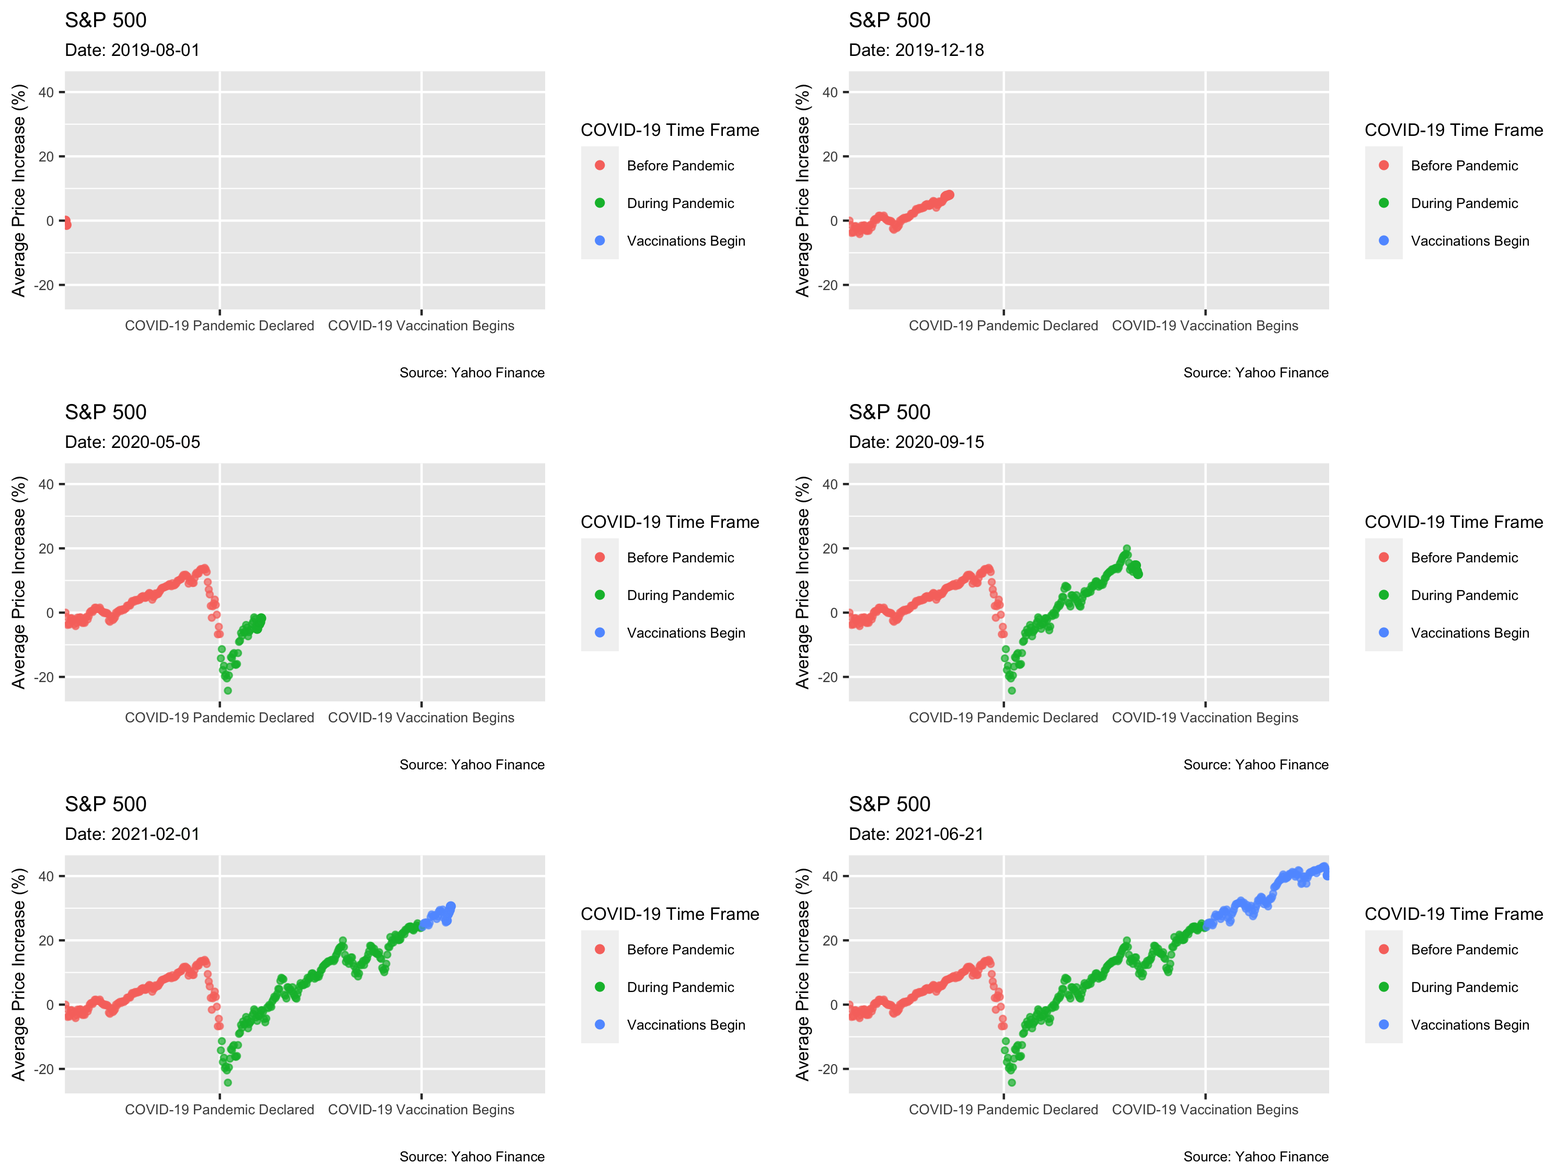
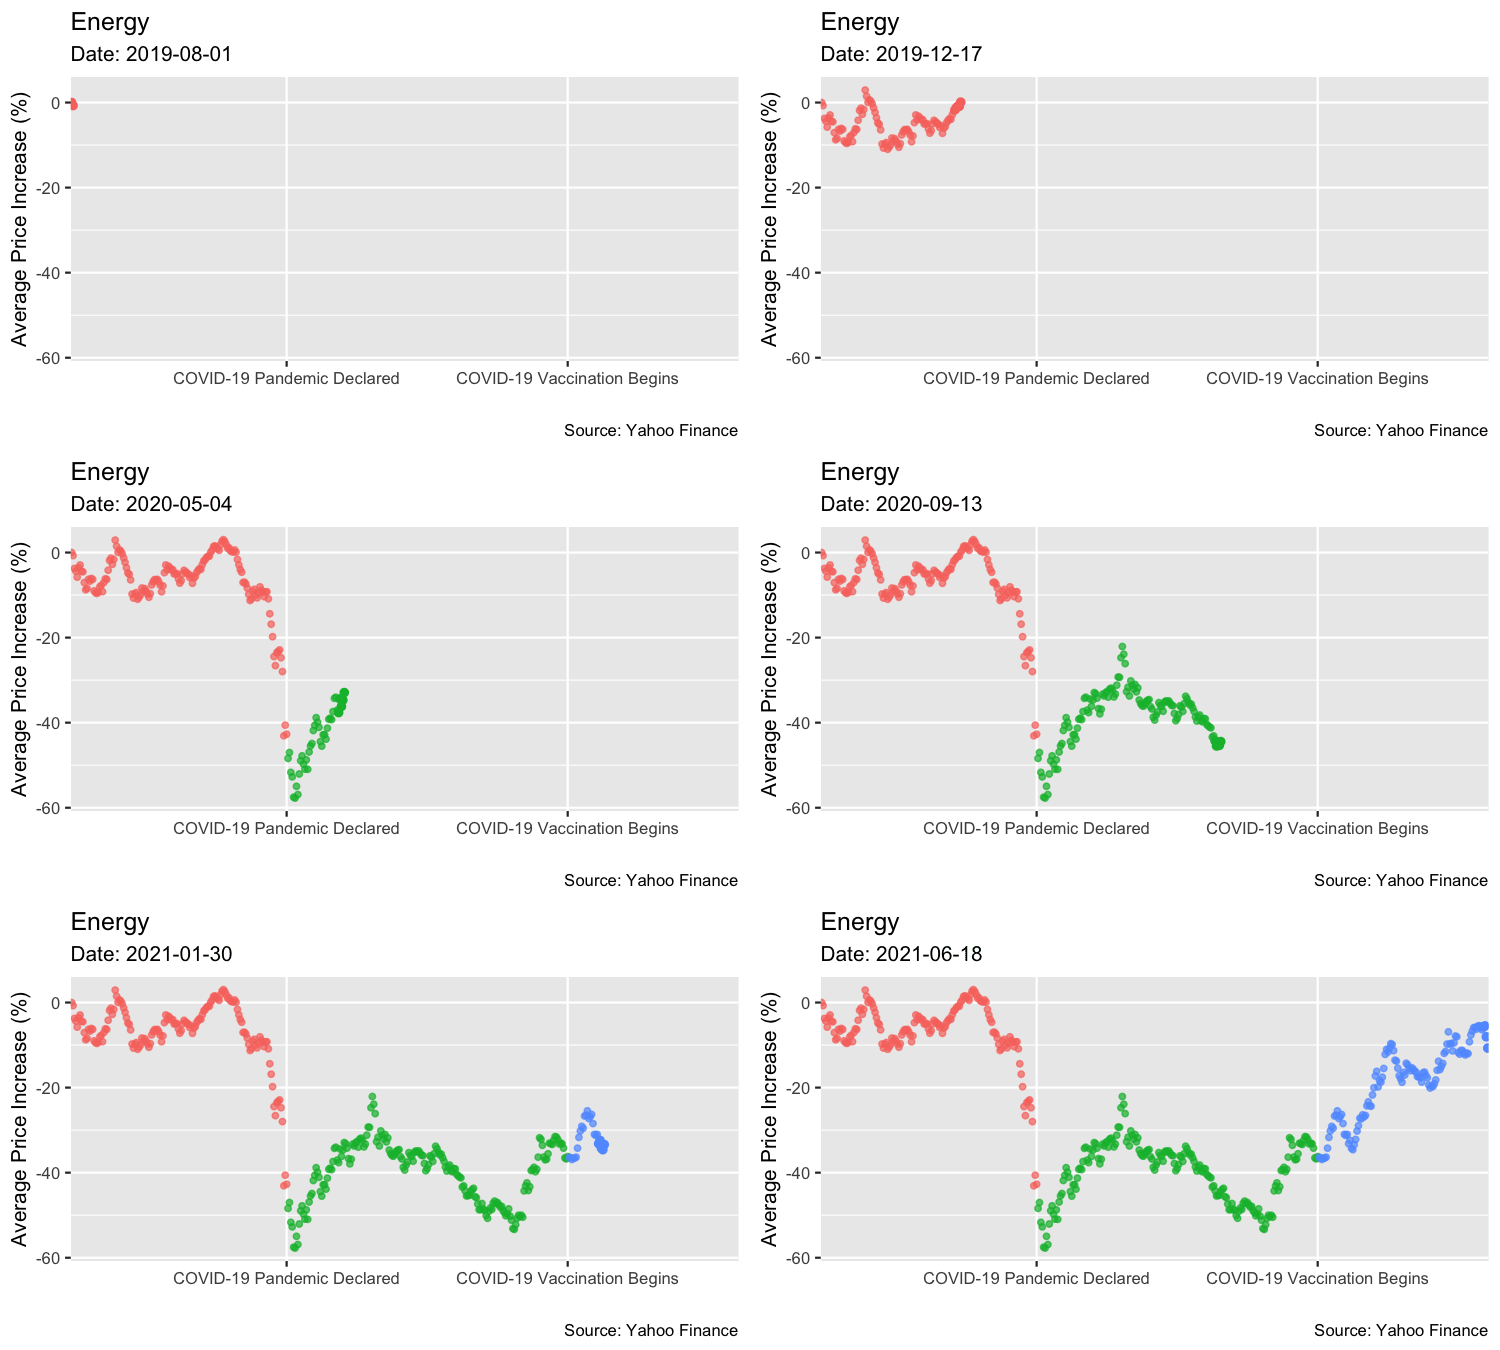
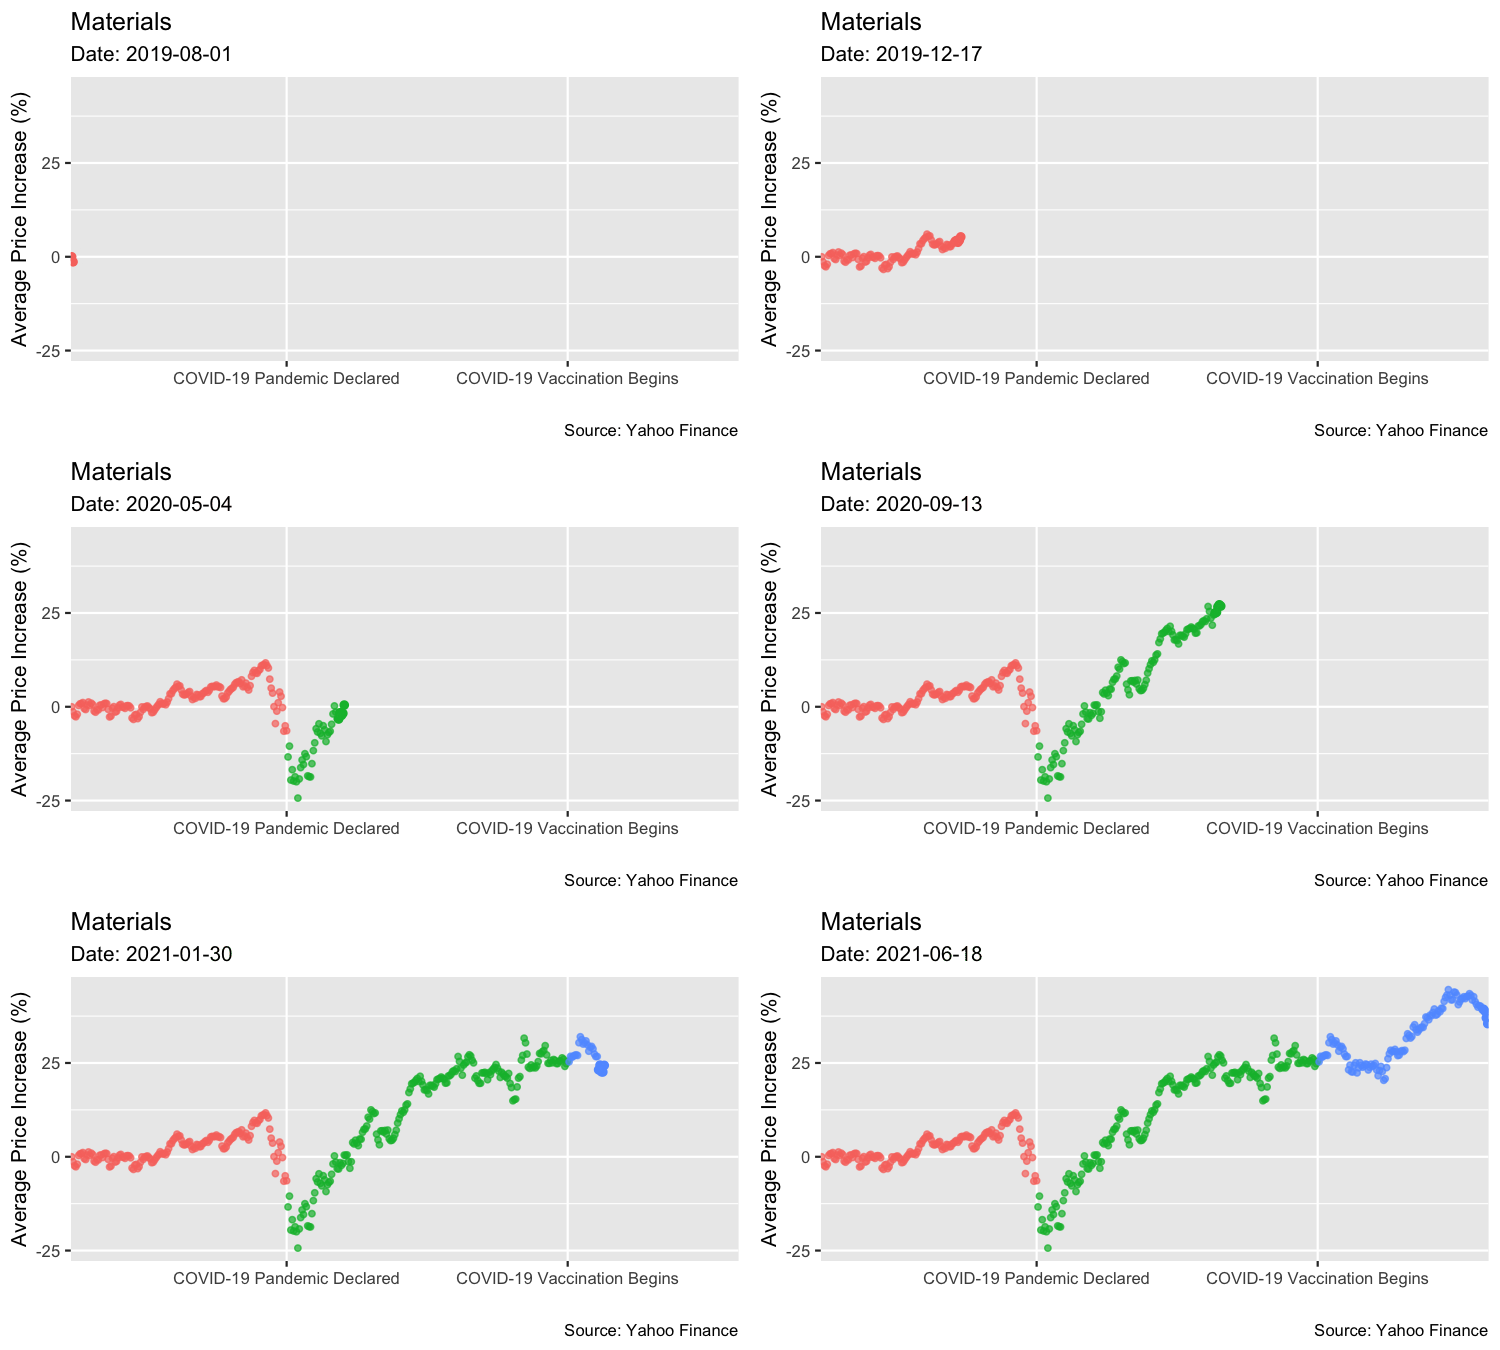
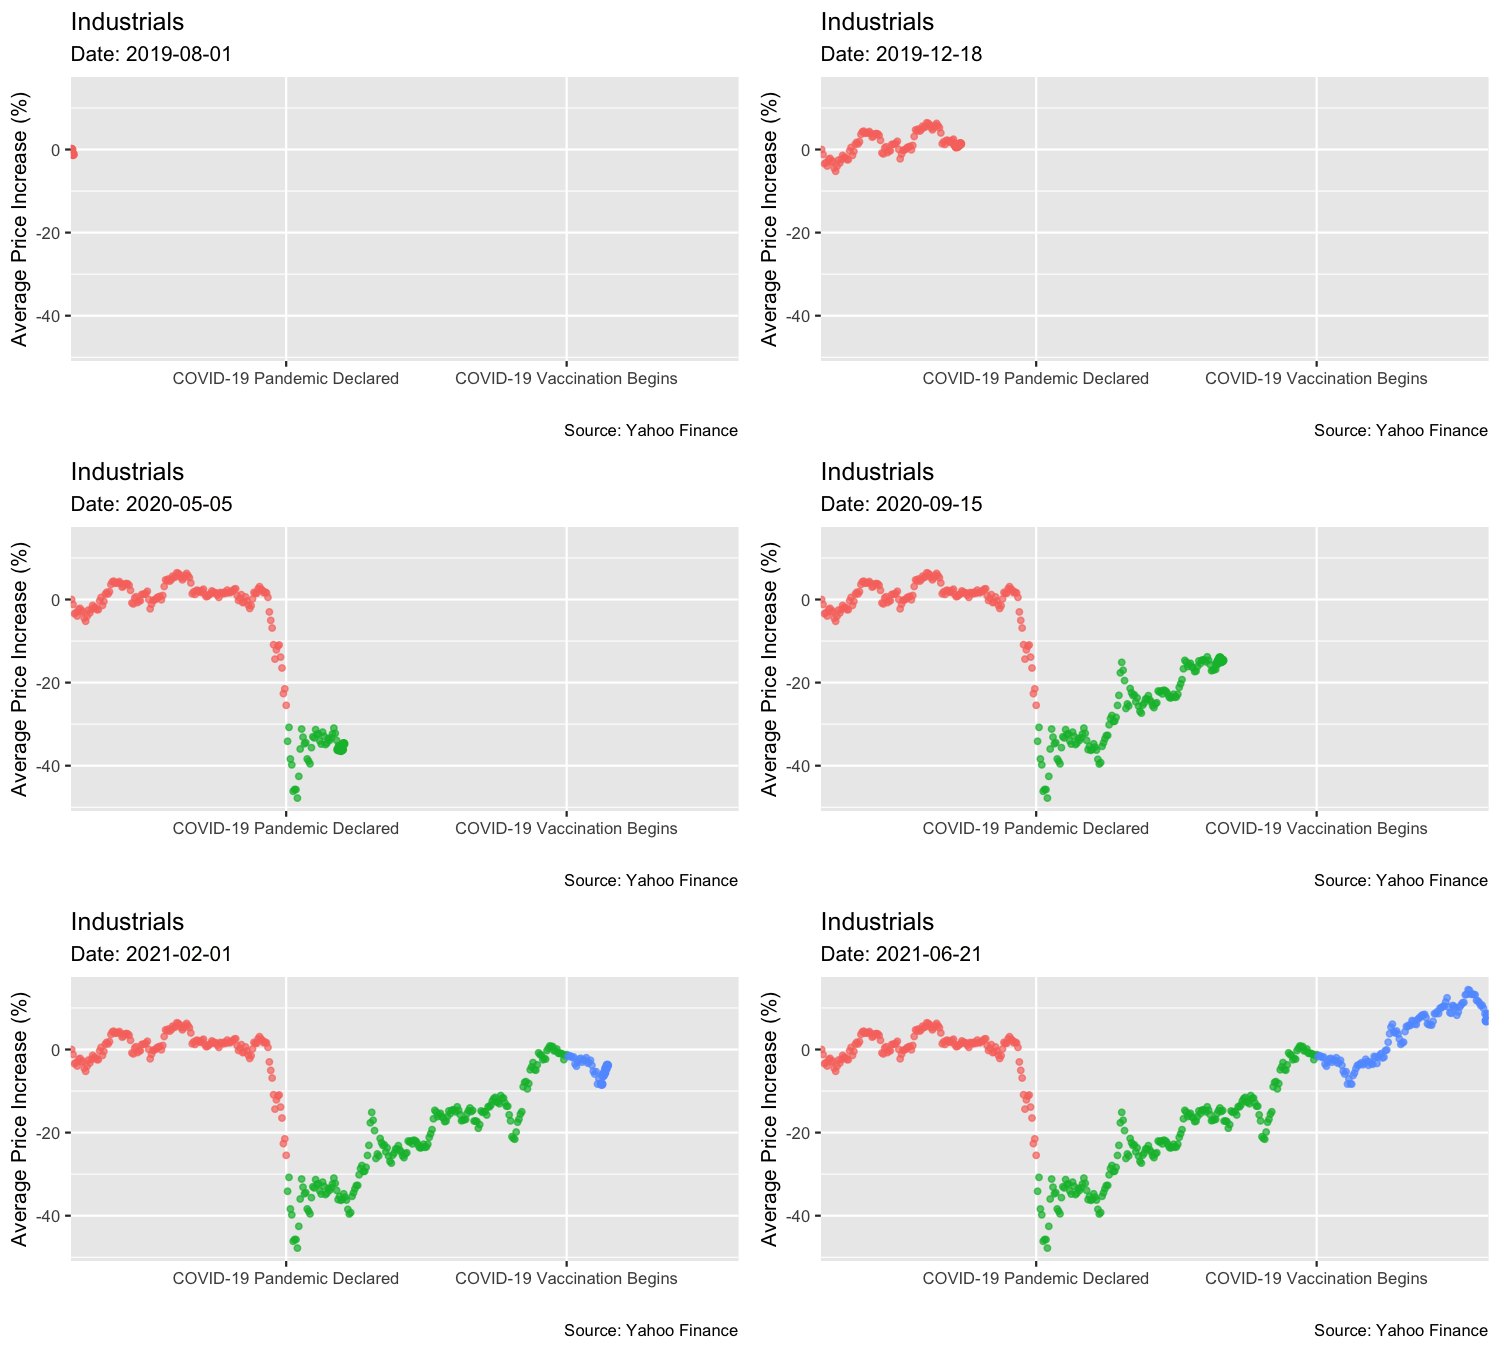
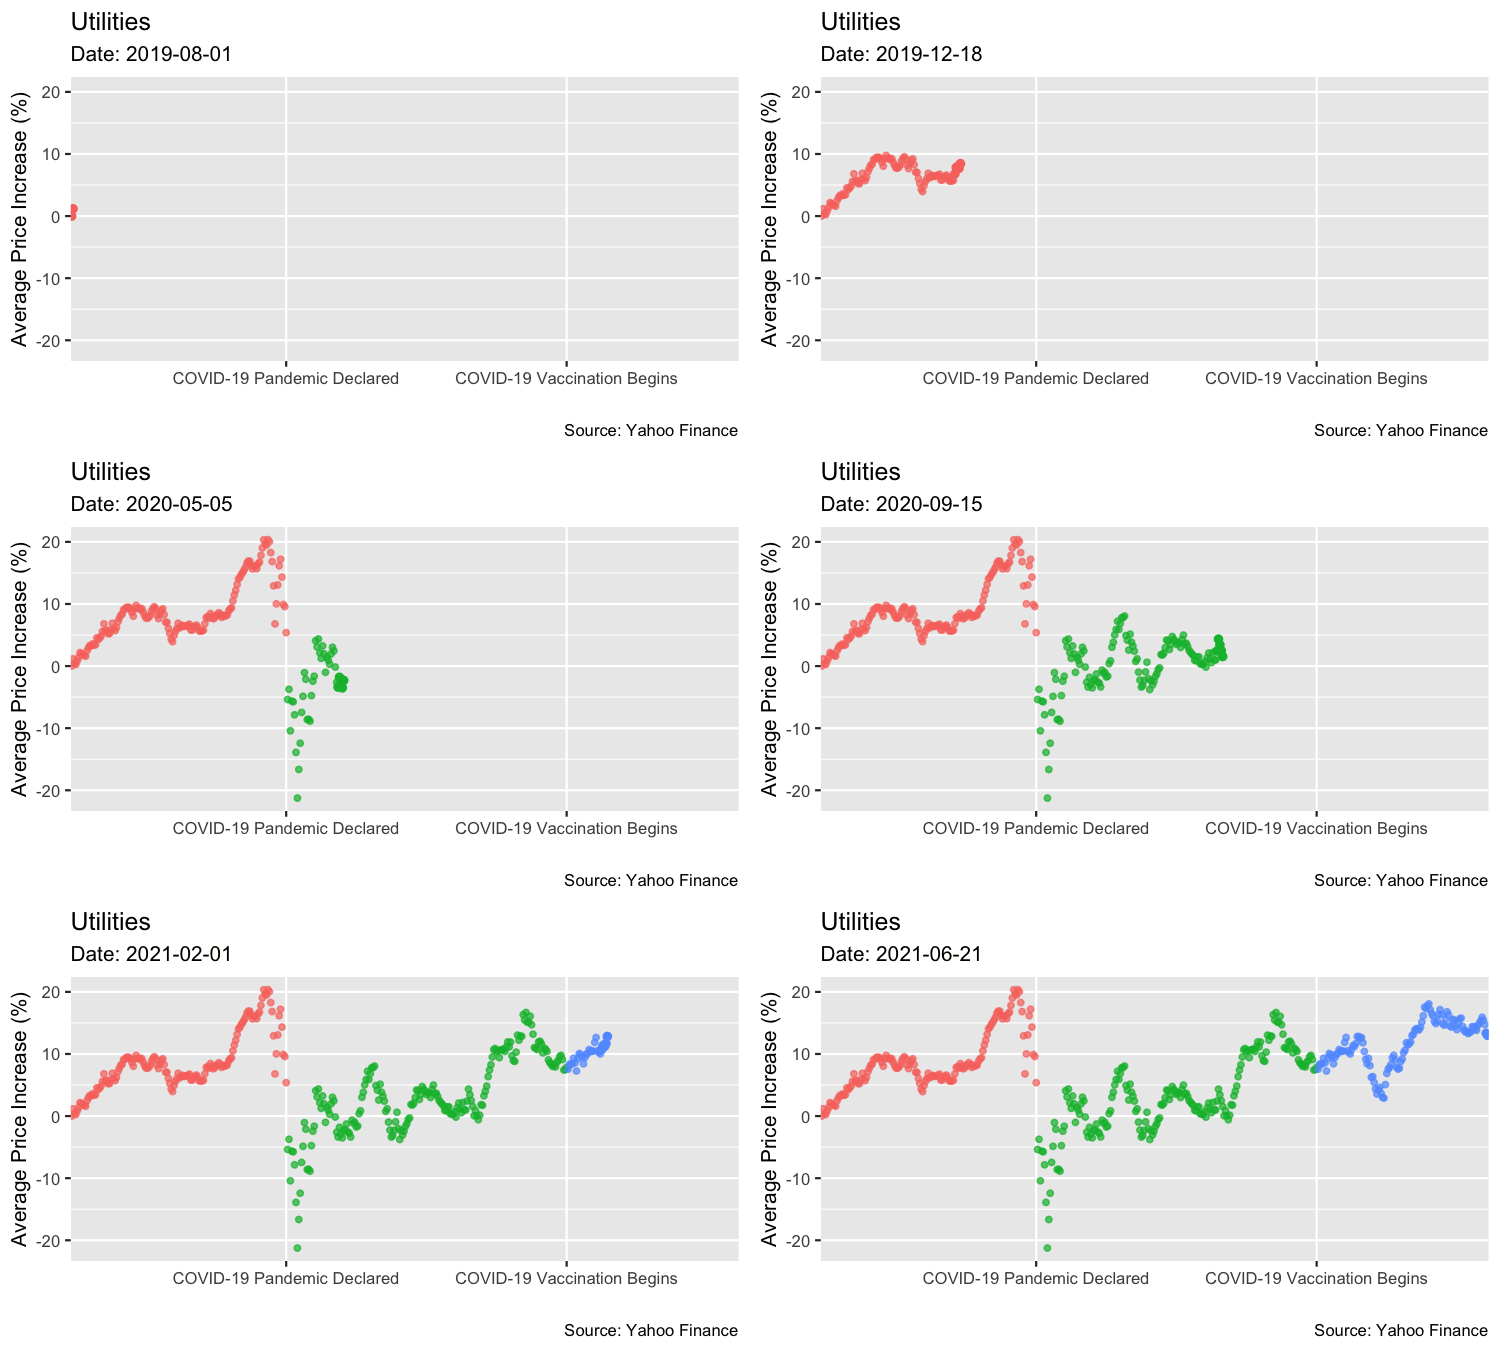
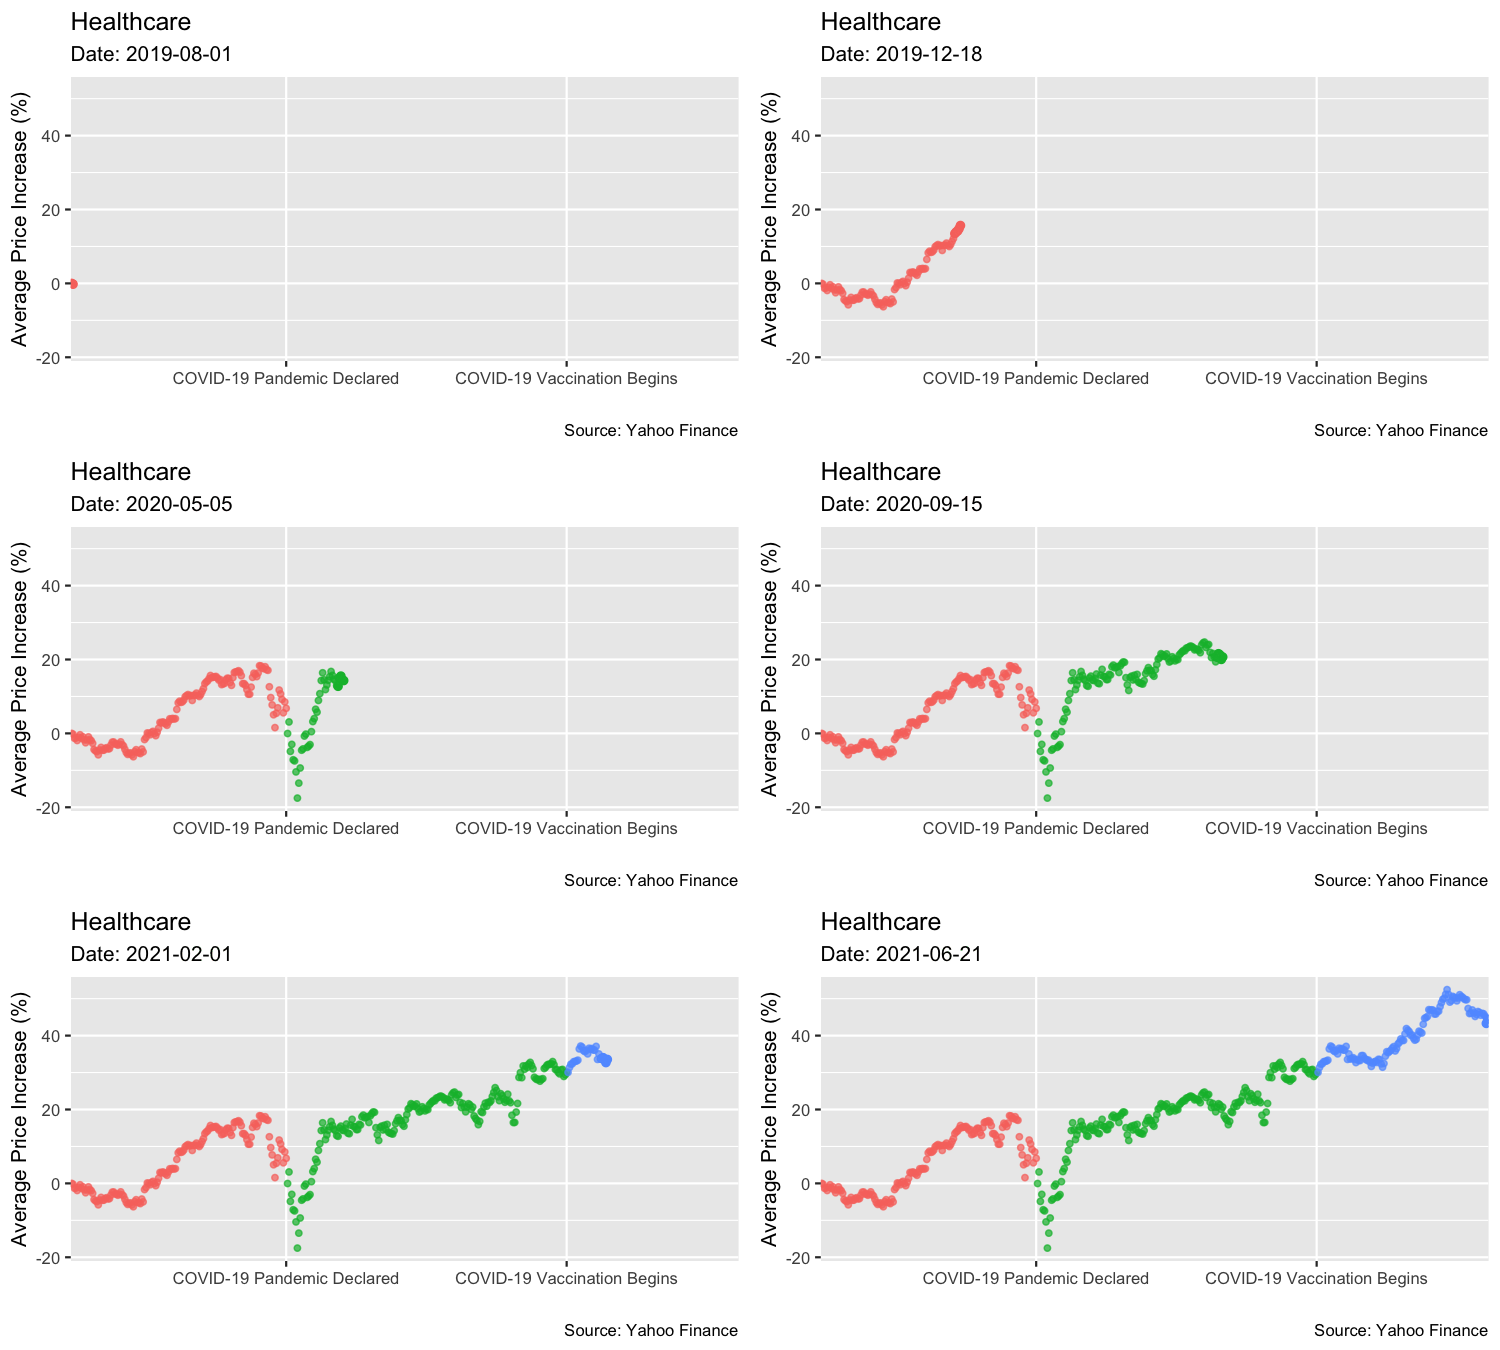
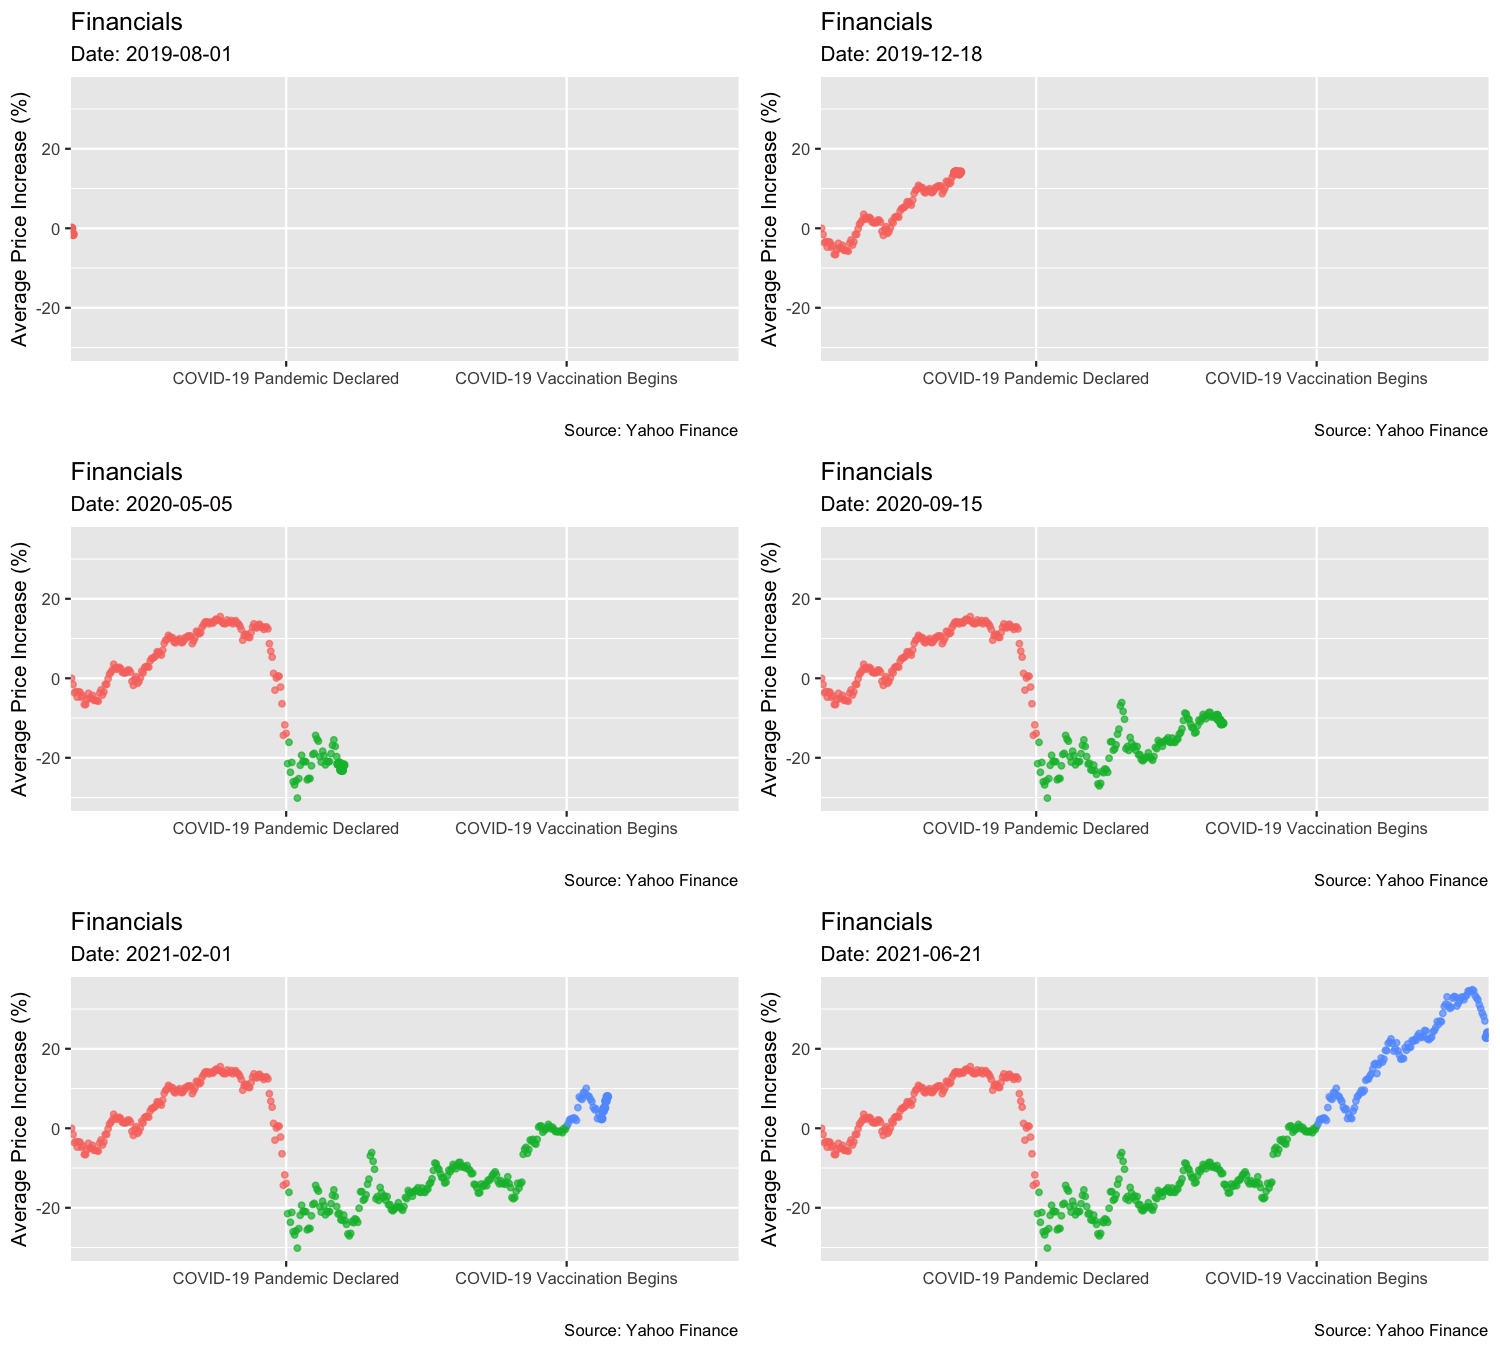
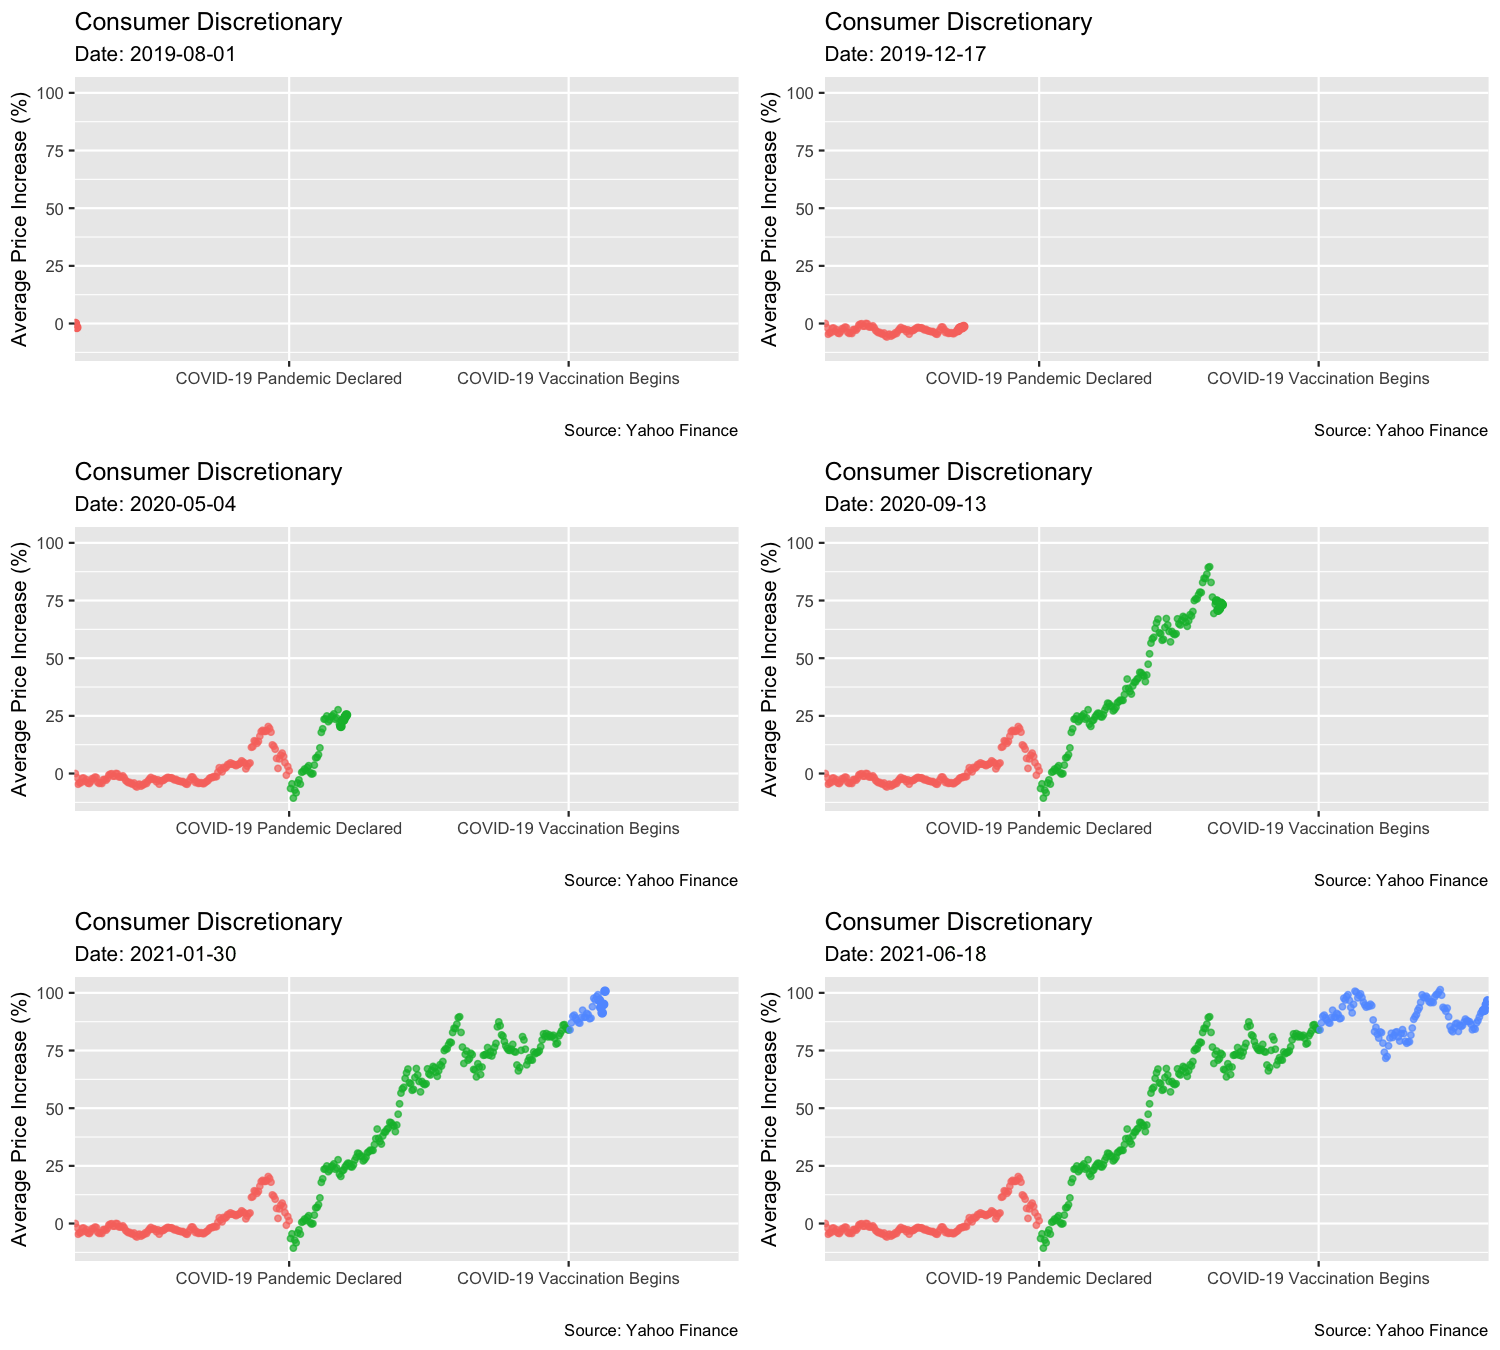
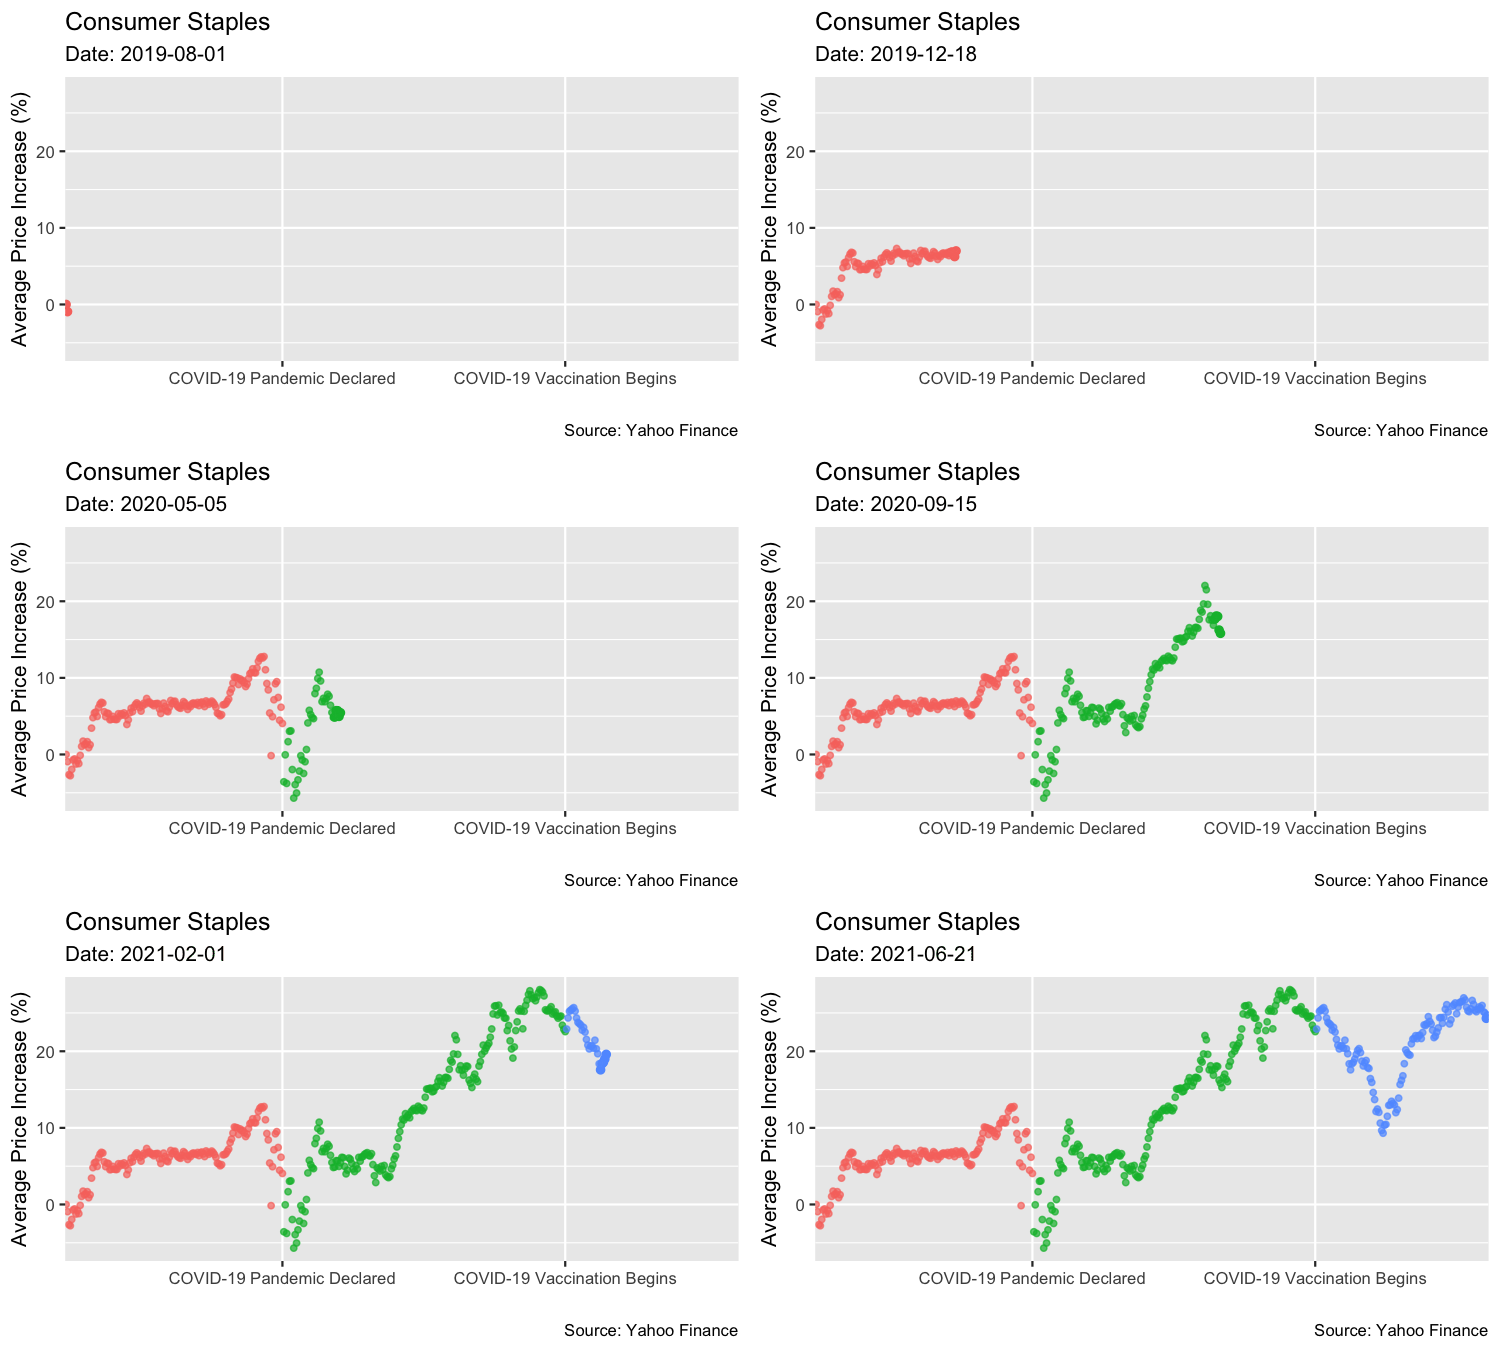
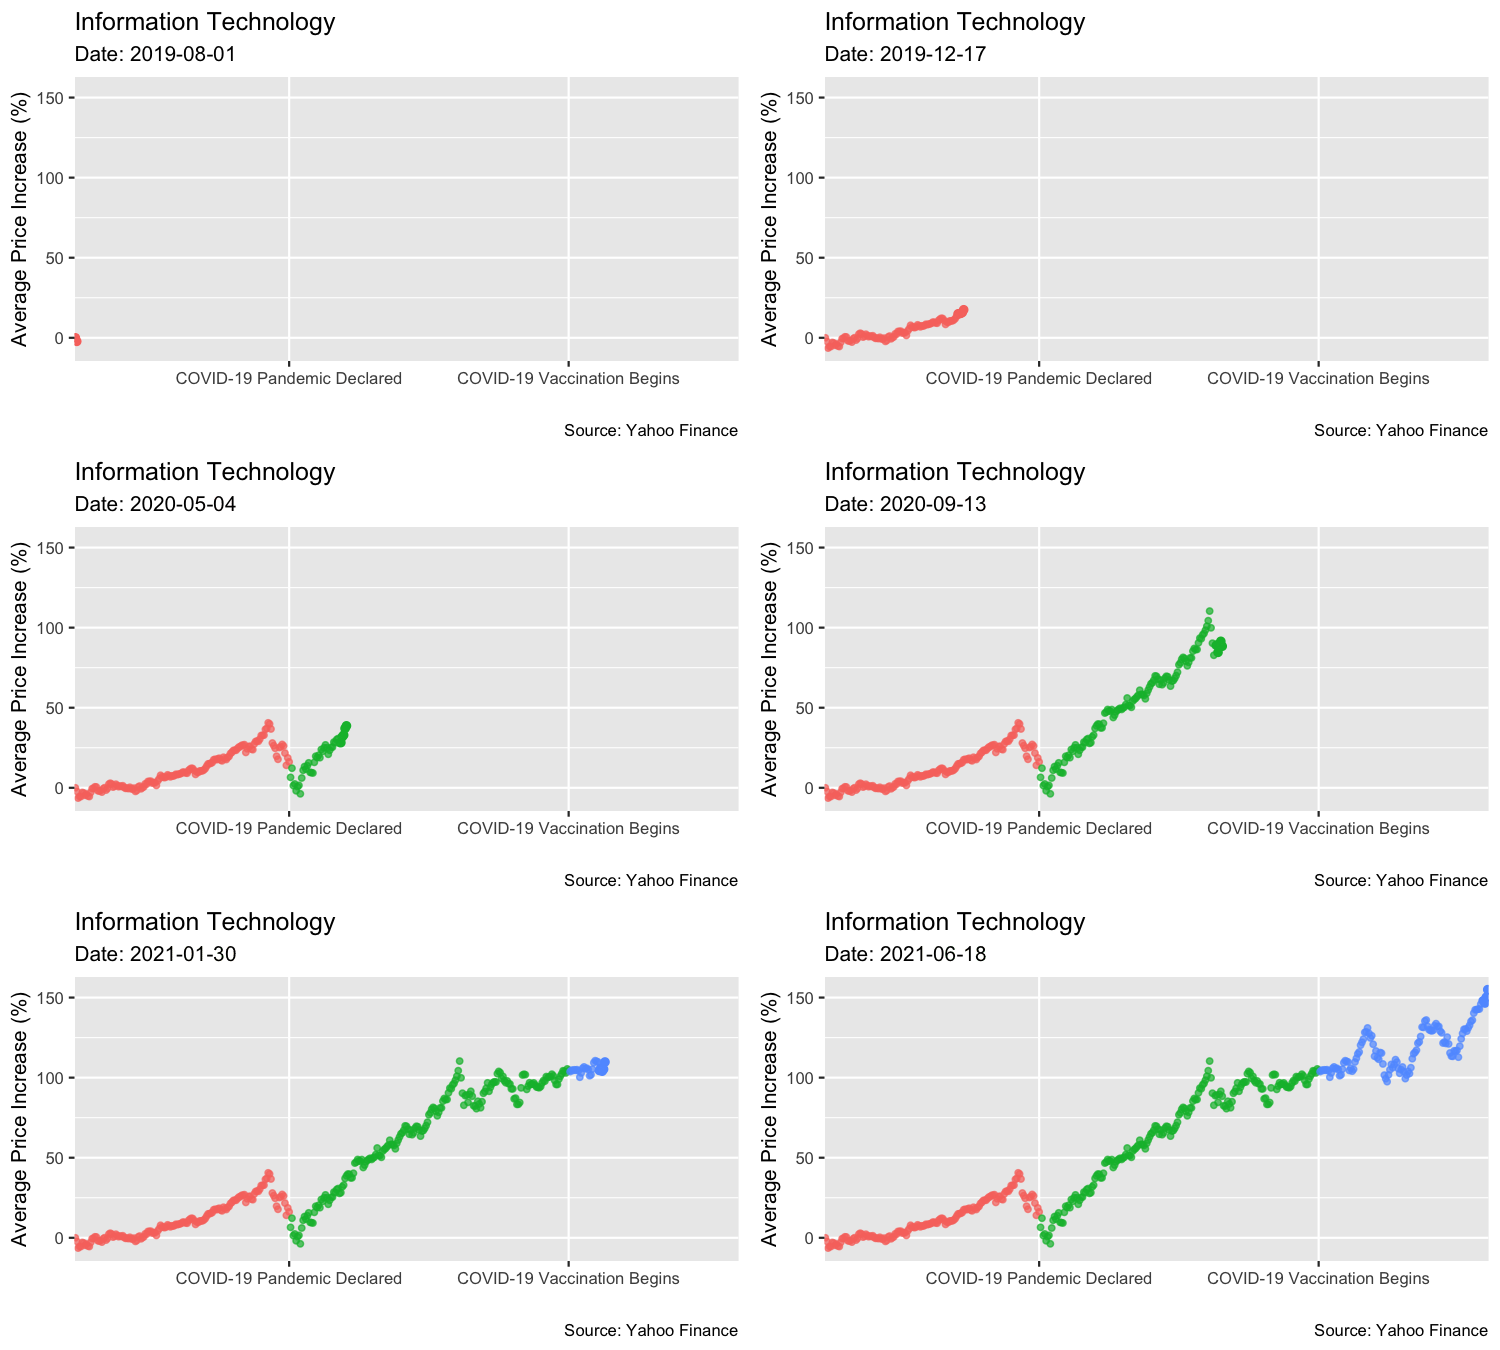
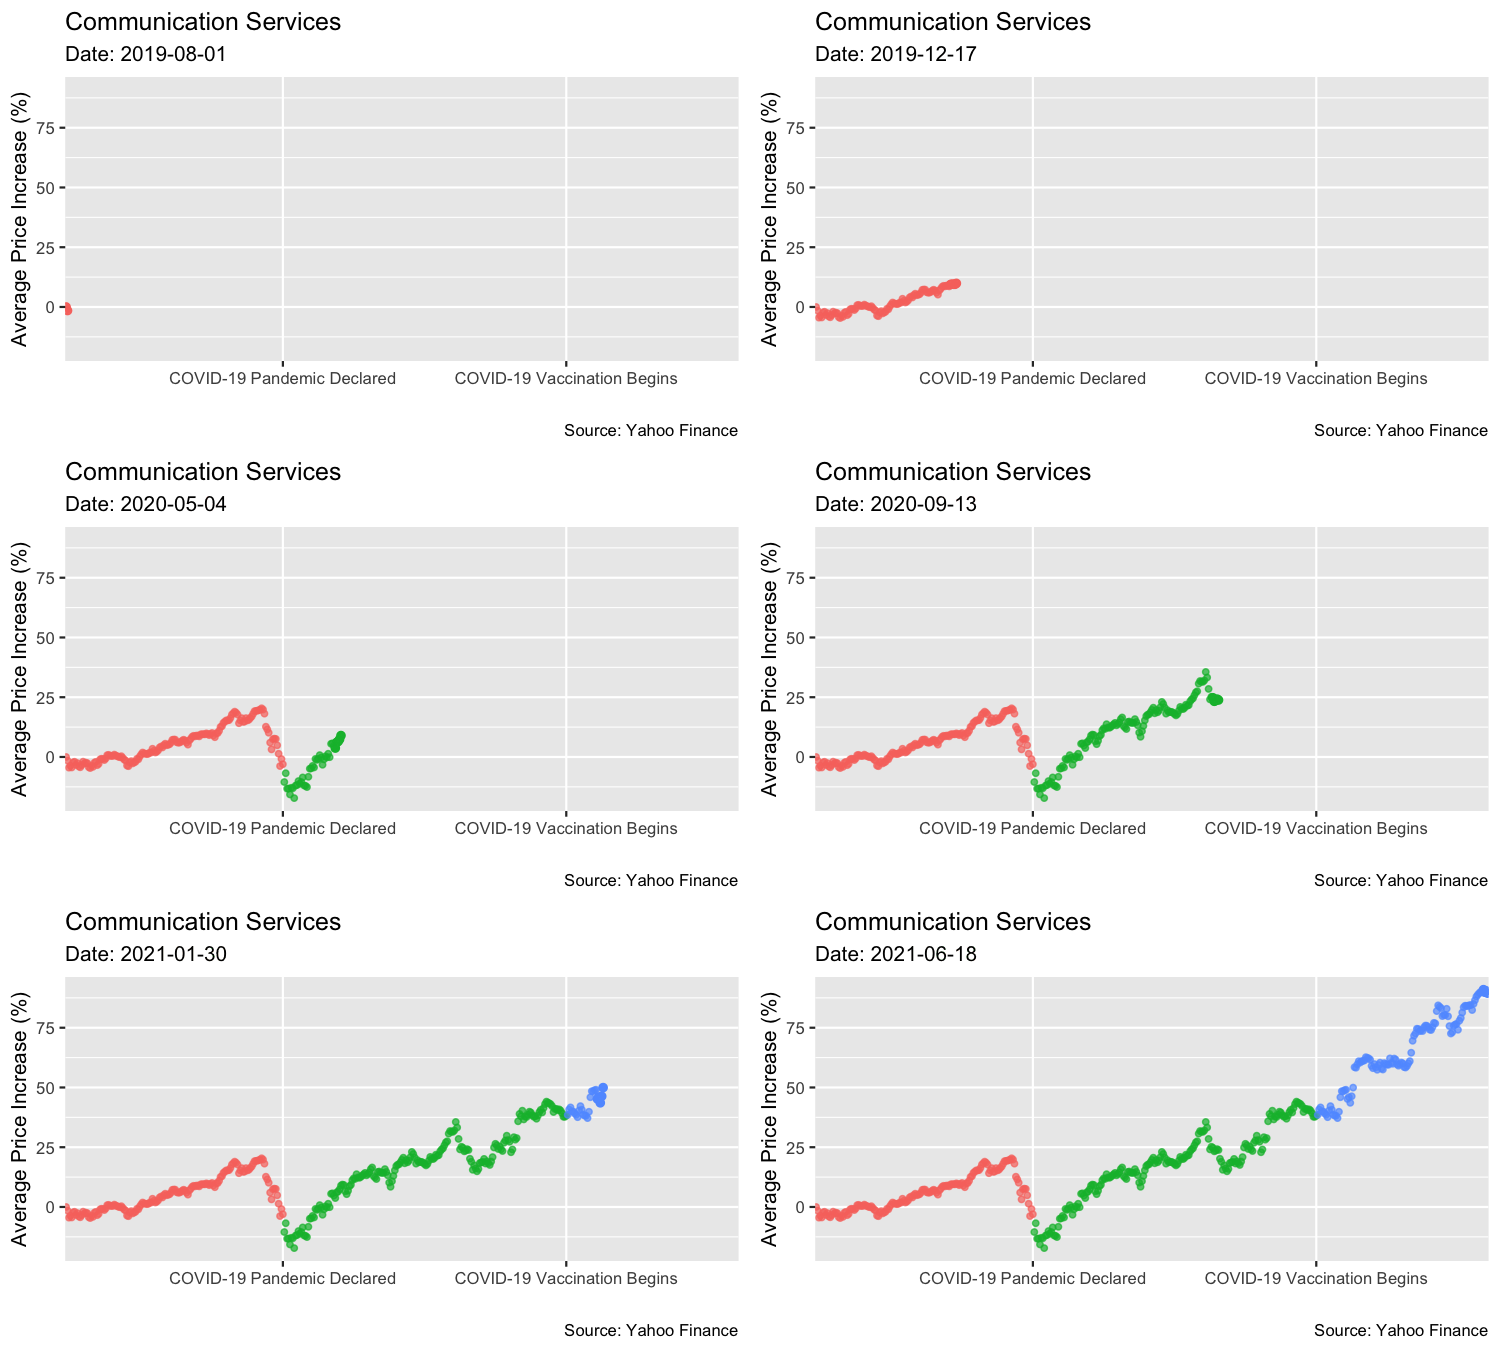
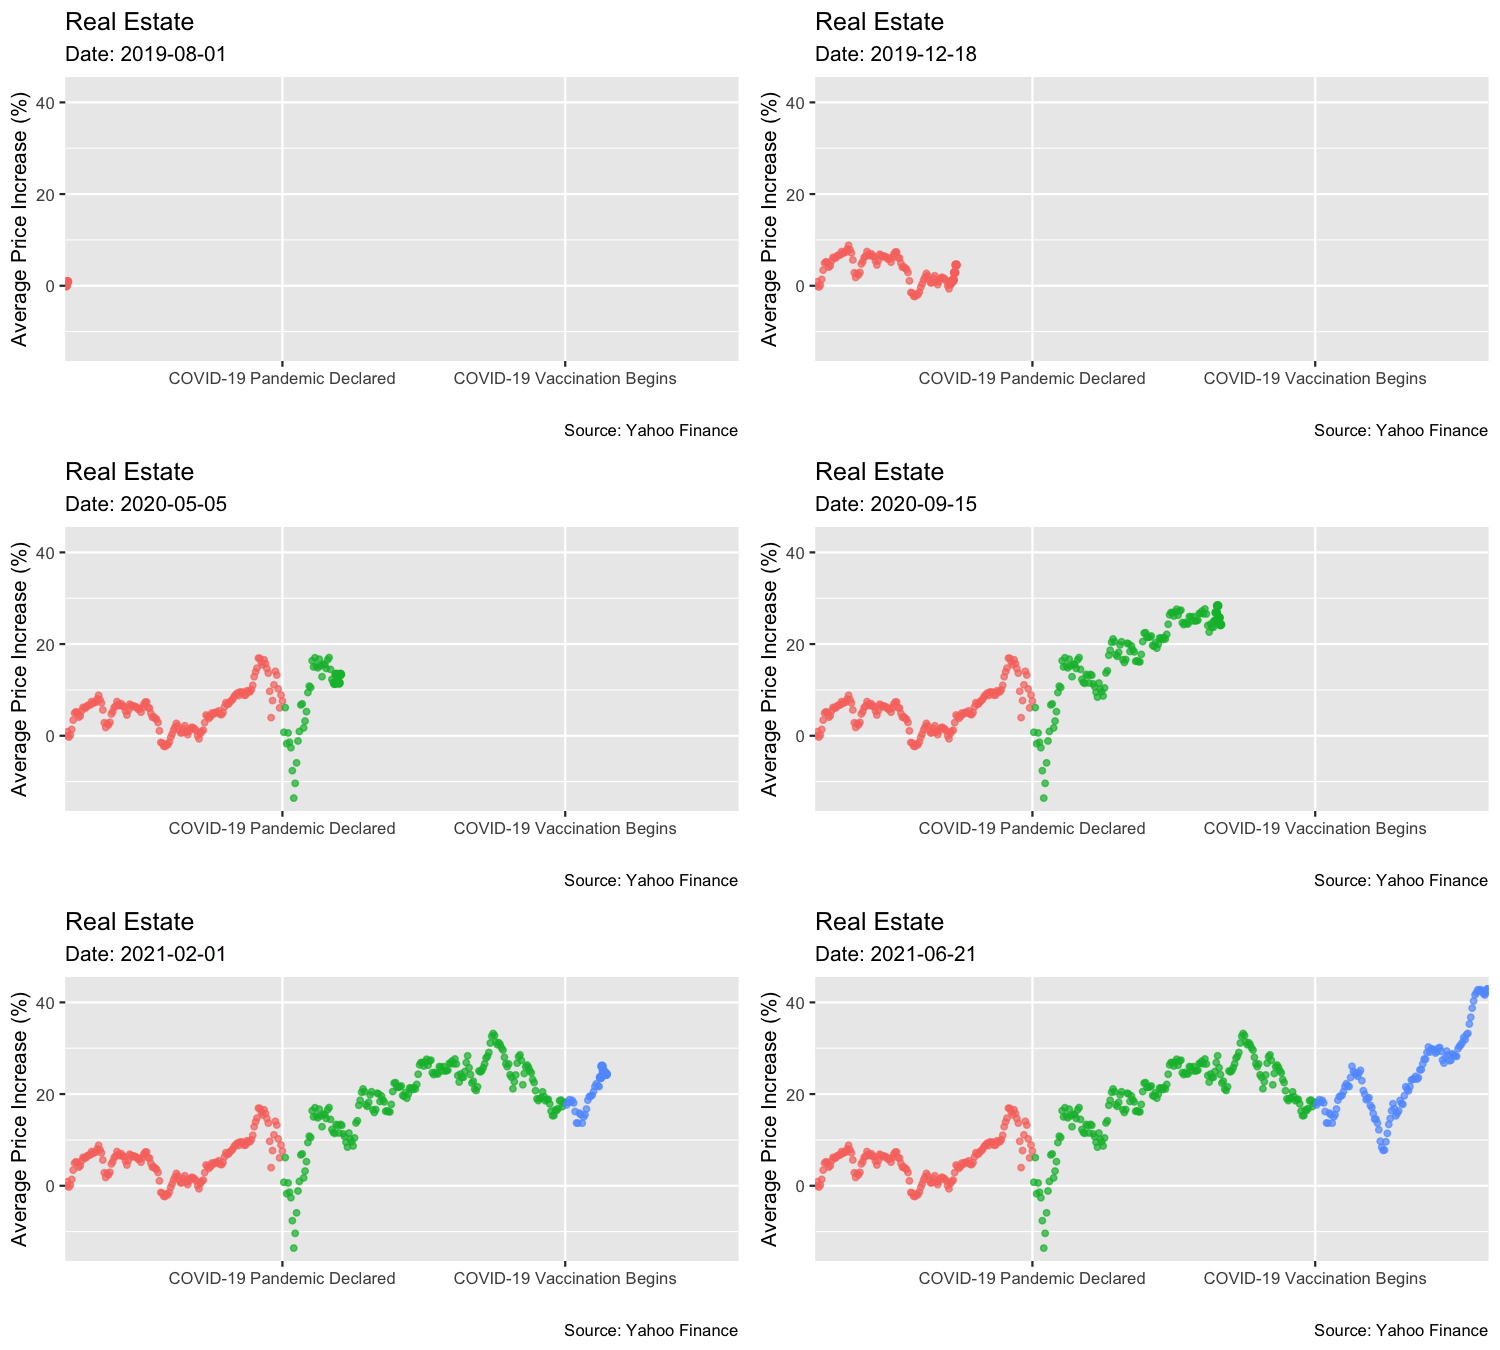
The following data represents the average percent change in value of the S&P 500 and its 11 GICS Sectors from before and during the pandemic. Significant events during the timeline of the pandemic are noted in the X-axis.
Collective Comparison
The following data represents the effects of the COVID-19 pandemic on the average percent change in value of the S&P 500 and its 11 GICS Sectors along the same scale.
Feel free to hover over interactive graph and view the data at a deeper level.